
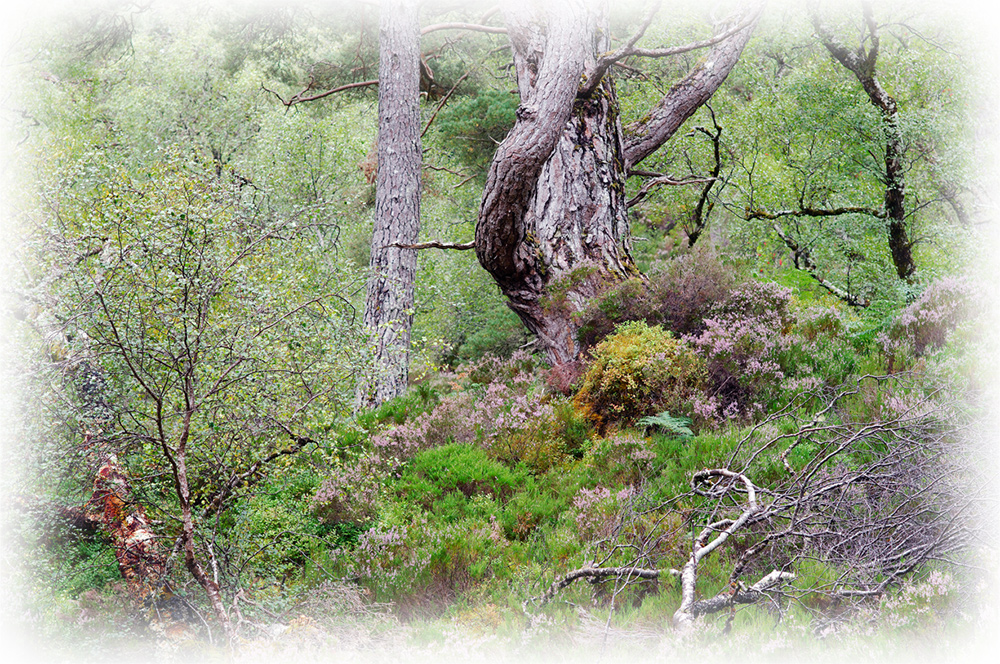
Habitat description
Native semi natural woodland includes a range of woodlands dominated by native species such as Scots pine, silver and downy birch, sessile oak and ash (see species list in right hand column). Other tree species found in these woodlands may include aspen, rowan and juniper. Scottish woodlands are 'semi' natural because they have been subject to a range of management (felling, burning and planting) over time. More 'ancient' woodlands tend to contain richer associated lichens, mosses and characteristic flora. Where more commmercial species or objectives exist (for example to establish trees to specify density or to maintain a set proportion of un-forked leaders), additional impacts may be measured.
Key Indicators
The key impact that deer can have are browsing on seedlings, fraying on saplings & bark stripping of mature trees. In addition, browsing can effect the structure and composition of ground-cover such a blaeberry. Information on the age, structure and condition of the woodland will indicate the timescale over which seedlings are needed to replace existing mature trees. A direct measure of deer browsing can be made on seedlings / saplings below deer browse height (approximately 1.3 m).
Other Impacts
Herbivores other than deer browse seedlings, particularly insects, rabbits, hares and voles. Factors other than herbivores (such as soils or seed viability) may also impede regeneration.


Woodland species:
Scots Pine/ Pinus sylvestris
Juniper/ Juniperus communis
Birch/ Betula pendula
Rowan/ Sorbus aucuparia
Aspen/ Populus tremula
Oak/ Quercus robur
Hazel/ Corylus avellana
Holly/ Ilex spp.
Hawthorn/ Crataegus spp.
Bird-Cherry/ Prunus padus
Willows/ Salix spp.
Ash/ Fraxinus spp.
| Method | What to measure | What to analyse |
|---|---|---|
| Plot based approach | The number, size and location of plots is based on area and distribution of mature trees.1 Plots are circular with an area of between 0.01 and 0.05 ha (i.e. using a string of 5-12 m from the central post). The centre of each plot is marked by a post and co-ordinates recorded by GPS. | Summarise the frequency of seedlings/ saplings, trees damaged by deer for each compartment.2 Graph the age profile of all mature trees for each compartment.appropriate or cost effective to fence a whole site, or accept very limited impact. Or No management may be considered necessary but provision should be in place should the situation change. |
| Within each plot, record: a. Number and species of all seedlings / saplings less than 1.3 m tall and or less than 7 cm diameter at breast height); b. Number and species of all trees greater than 1.3 m tall and or greater than 7 cm diameter at breast height); c. Number of seedlings / saplings with deer damage;* d. Number of trees with deer damage; e. Number of standing dead, fallen dead and tree stumps; f. ‘Age class’ of all mature trees. | Calculate the frequency** of leaders browsed for each species of seedling / sapling for each compartment. Calculate the frequency of other shoots browsed for each species of seedling / sapling for each compartment. |
|
| Assess whether saplings have been frayed by deer.* | Average the number of saplings frayed per species per compartment |
|
| Assess whether trees have been bark stripped by deer.* | Average the number of saplings frayed per species per compartment |
|
| Marked seedlings approach | Mark at least one seedling / sapling within each plot OR randomly select a minimum of 30 seedlings within each compartment. Measure seedling / sapling height (straight vertical distance from ground to highest point on the seedling without lifting or stretching − see illustration above. Assess whether the leader and other shoots on each seedling are browsed by deer (based on clean cut/ragged cut).* | Average the height of seedling for each compartment. Summarise the number of seedlings/ saplings, trees and dead trees per compartment. |