The Aim
 The aim of this guide is to describe how to go about analysing and interpreting the data collected from habitat impact assessment. Interpretation will depend on objectives but a clear trend will indicate which way the habitat is ‘going’.
The guides “Habitat Impact Assessment: Principles and Habitat Impact Assessment: Principles in Practice” should be regarded as essential introductions to this subject.
Why analyse data?
To assess:
1. Whether any impacts are changing over time;
2. What changes mean in relation to the objectives for the habitat*.
How to analyse
For each habitat:
- Average the frequency of each impact (see an example for heather in the right hand column);
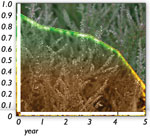
- Look at the trend in the averages over time (i.e. is the impact increasing, decreasing or staying the same?)
Example of averaging the frequency of of quadrats with heather present within a plot
Habitat area (site) has minimum of 30 random plots. Each plot (2m x 2m) is subdivided into sixteen 0.5m X 0.5m quadrats. For this example, only 3 plots have been used for simplicity
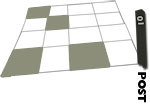
Plot 1: heather present in 4 quadrats
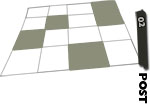
Plot 2: heather present in 5 quadrats
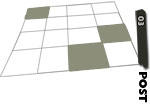
Plot 3: heather present in 3 quadrats
Steps
Plot 1: heather present in 4 quadrats
Plot 2: heather present in 5 quadrats
Plot 3: heather present in 3 quadrats
Step 1: For each plot calculate the frequency of quadrats with heather. That is
Plot 1: 4/16 = 0.25
Plot 2: 5/16 = 0.31
Plot 3 3/16 = 0.19
Step 2: Average the frequency of quadrats with heather for all plots. That is
(0.25 + 0.31 + 0.19) ÷3 = 0.25
Interpretation
- Compare changes against the objectives for the habitat (see example table below).
- Consider other relevant data (for example, deer count information, sheep numbers).
- Take into account timescale and likely impact of changes recorded (for example, in woodland: are sufficient seedlings escaping browsing to replace existing trees?). Normally habitat change is quite slow. A series of measures over 3 – 5 years will probably be needed.
- Note that it is not just trends that need to be taken account of but the level of impact. For example if Moderate of High impacts (greater than 33% shoots browsed**) are recorded on heather year after year (but no change in trend) then they are likely to lead to a loss of heather.
| Public interests and deer management objective for Dwarf Shrub Heath | Specific definition of ‘damage’ | Who determines ‘damage’? |
| Authorisation (prevent serious damage) *** | Heavier impact recorded than owner willing to accept | SNH |
| Section7 control agreement (prevent serious damage)**** | Deterioration from baseline in either extent or integrity | SNH |
| Good Agricultural and Environmental Condition |
Clear evidence that growth, quality or species composition of the vegetation is deteriorating to a measurable extent | SGRPID |
| SSSI interests ***** | Measurable decline in the area of the feature or deterioration in condition | SNH SNH SGRPID FCS |
| Natura interests***** | Extent, structure and function of impacted habitat threatened. Negative consequences for typical species |
SNH SNH SGRPID FCS |
| Occupier rights to shoot in close season1 | Heavier impact recorded than required | owner/ occupier |
| Owner / occupier objectives (open season) | Habitat not in condition required | owner/ occupier |
What Next?
Depending on the trends and the objectives – public or private, may need to:
- Consider changing deer management, for example increasing cull;
- Look at incentives available i.e. grants to improve habitat.
