
Aim
The aim of this guide is to provide advice and information on estimating deer populations in woodland1
Introduction
Accurately estimating the number of deer utilizing areas of woodland is difficult. It is important that deer and woodland managers recognise and accept this especially when setting deer cull targets.
It is possible to broadly evaluate deer densities into low, medium and high categories by collectively looking at indicators of the presence of deer such as the quantity and distribution of dung and tracking, whilst at the same time evaluating deer impacts.
Woodland Deer Density Indicators
| Evidence | Low Density (0-6 deer per km2) | Medium Density (6-12 deer per km2) | High Density (12+ deer per km2) |
| Tracks | Difficult to find deer slot marks or defined paths. | Defined paths; slot marks easy to find in areas of soft ground. | Many well defined tracks and paths often black with constant use. |
| Dung | Difficult to find with just the odd isolated pellet group. | Pellet groups relatively easy to find, particularly on woodland edges and good feeding areas. | Pellet groups very easy to find. Highly concentrated on favoured feed areas. |
| Browsing of Vegetation | Natural regeneration of broad-leaved trees taking place with no or little damage to current year’s incremental growth | Broad-leaved saplings present but showing significant damage. | No seedlings growing above dominant vegetation height. Often well defined browse lines on established shrubs and plants. |
Dung counting
Dung counts are useful for estimating:
- the use that deer make of an area of ground;
- the total number of deer in an area.
In a population with little or no movement, this method works on the basis that the number of pellet groups will reflect the number of animals. The main advantages of this method are:
- It estimates average numbers and use (direct counts only provide a snapshot);
- It provides a means of estimating deer numbers in woodlands;
- It is the most cost-effective means for measuring density in large areas of woodland;
- It can be used as a tool to monitor change and the impact of management actions.
It is worth noting, however, that movement of deer in and out of an area is likely to occur.
Pre-survey planning
The following points need to be taken into consideration before any survey is undertaken:
- Establish what the information is to be used for (i.e. to estimate deer useage and trends or to estimate population numbers?) and work back to define the method to be used.
- Identify the size of the area to be surveyed, taking into account possible movement of deer.
- Assess priority for management: High priority – high value/ vulnerable crop or habitat.
Medium priority – mature, pre-felling/ re-stocking sites.
Low priority – semi-mature, low risk sites. - Break down the area into different habitats either by age and vegetation type to allow samples to be stratified.
- Prior to fieldwork, become familiar with the different species present using known pellet groups.
Examples of habitat stratification
Woodland Habitat
Conifer establishment 0-5 years old.
Conifer pre-thicket 5-10 years old.
Conifer pole stage/ pre-felling.
Mature forest.
Broadleaved establishment.
Open Habitat
Bare ground.
Grass rides/ glades.
Moor/heath.
Fields.
Method
- Mark out permanent plots and search carefully for dung, which is either removed or marked.
- Revisit the plots, usually 10-12 weeks later (before the dung has time to decay), and count the numbers of pellet groups accumulated on each plot. Note: decay rates vary between habitat types and season.
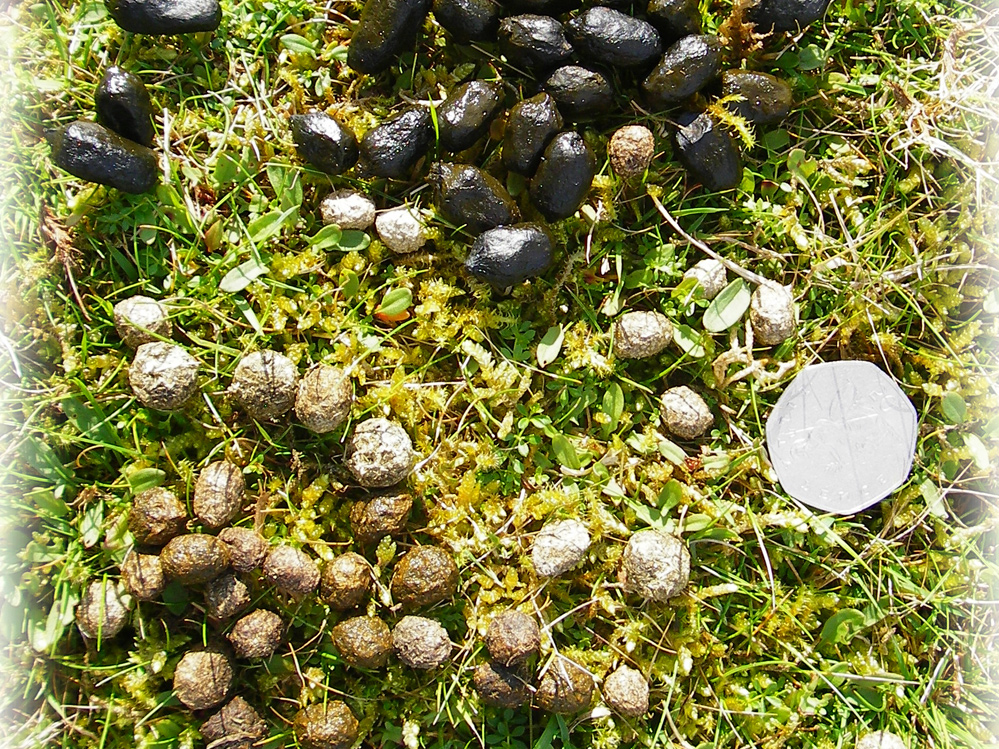
- Count only clusters of 6 or more pellets as a pellet group.
Number of Plots
- Allocate survey areas in each habitat type with a minimum of 6 plots in each.
Size of plots
- Determine the size of the plot by the density of vegetation.
From a practical point of view, moderately sized plots (50-200 m2) are preferable for obtaining reasonable numbers of pellet groups per plot, as they maximize the time spent searching, and minimise travel time between plots. For each habitat, size of plot should be consistent and will be dependent on vegetation type and ease of search e.g. heath-50m2, conifer pole stage-200m2. Plots can be linear (transects) as well as rectangular in layout.
When to sample
- Carry out sampling during winter and early spring when pellet groups are not concealed by vegetation.
Daily Defecation rates
Defecation rates for individual species are necessary for calculating population densities. These are estimated as red (25 pellet groups per day), sika (25 pellet groups per day), fallow (20 pellet groups per day) and roe (20 pellet groups per day).
Calculating deer density
Example
Clearance counts were carried out in an area of pole stage conifer with sparse understory to estimate the density of roe deer. Pre-survey investigation of decay rate indicated a decay period of 6 months.
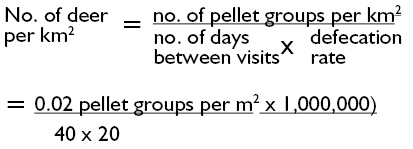
Plots totalling 1200m2 were cleared in November. A total of 6 pellet groups were counted in the plots 60 days later. Assuming a defecation rate of 20 pellet groups per day (and no decay between visits), the population density is estimated as:
A period of around three months between visits is recommended, however, the time in practice will depend on knowledge of the decay length relative to the habitat and season.
- Be aware of the potential error margins surrounding population calculations and therefore limitations in the value of the information generated as a basis for management decision making.